- Jan 26, 2026
Stream Tables, Not Spinners: Progressive Table Rendering
- Teddy Kim
- 0 comments
User clicks "Generate Report." Spinner appears. They wait. And wait.
Thirty seconds later, 100 rows appear all at once.
Here's the thing: row one was ready after 300 milliseconds. But the user waited thirty seconds to see anything.
This is the traditional approach to data tables. The table is either empty or full. Loading is a boolean. And users stare at spinners while perfectly good data sits waiting server-side.
There's a better way. Stream rows as they're computed. Let users interact with partial data. Give them something to look at in 300 milliseconds instead of 30 seconds.
This is the Tabular Stream View pattern. And it changes how users experience data-heavy applications.
The Mental Model Shift
If you've built data tables with REST APIs, you're used to this flow: request, wait, render everything. The table is binary. Empty or full.
With streaming tables, loading is a spectrum. You have five rows. Then six. Then seven. Each row is independently useful. And the user doesn't need rows 8 through 12 to start analyzing rows 1 through 5.
The mental model shift is this: time to first data matters more than total time.
Even if both approaches take 30 seconds total, the streaming version feels dramatically faster because users see progress immediately. They're not staring at a spinner wondering if anything is happening. They're reading data, sorting columns, planning their next action.
And here's the real unlock: they can interact while the stream is still running. Sort, filter, export—all while more data loads in the background.
How Streaming Tables Work
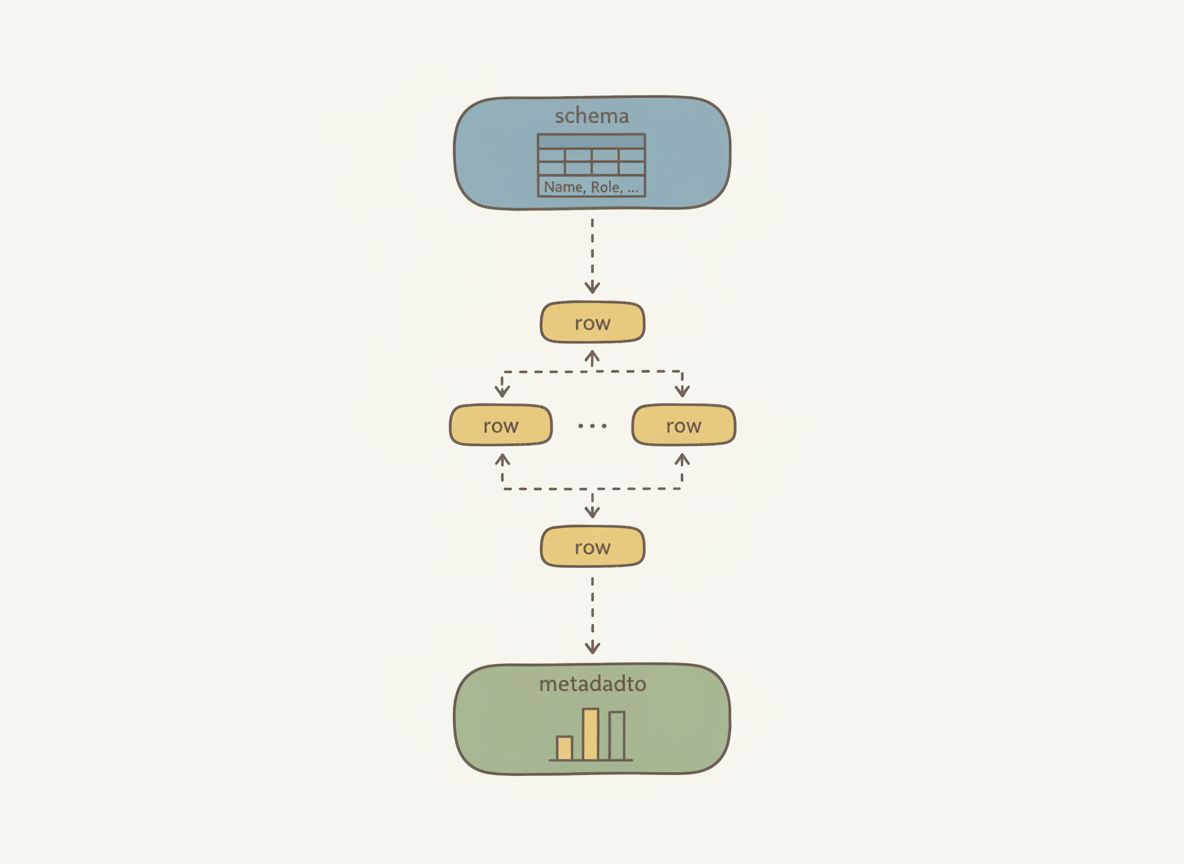
The stream has three event types.
Schema arrives first. It defines your columns, data types, and a hint for total rows. This is crucial. The UI knows the table structure before any data arrives. Headers render immediately. Skeleton rows can appear. The experience feels instant.
Rows arrive progressively. One at a time. Each row gets pushed to state as it arrives. The table grows. Users can start reading while more data loads.
Metadata lands last. Aggregations, totals, averages. This signals completion and provides summary statistics for the footer.
Here's what the schema looks like:
export interface ColumnDefinition {
  id: string;
  label: string;
  type: 'string' | 'number' | 'boolean' | 'date';
  sortable?: boolean;
  filterable?: boolean;
  unit?: string;  // 'percent', 'currency', 'hours'
  aggregation?: 'sum' | 'avg' | 'min' | 'max' | 'count';
  width?: string;
}

export interface TableSchema {
  columns: ColumnDefinition[];
  totalRows?: number;  // Hint for skeleton loaders
  title?: string;
  metadata?: Record<string, unknown>;
}
The schema is rich. Each column declares whether it's sortable or filterable. Numeric columns specify units and aggregation functions. Column widths can be defined upfront to prevent layout shift.
This schema-first approach is what makes the pattern work. Without it, you can't render headers or skeleton rows until the first data arrives. With it, the table feels instant.
Implementation: The useTabularStream Hook
The React implementation centers on a single hook:
const {
  schema,        // TableSchema | undefined
  rows,          // TableRow[]
  metadata,      // TableMetadata | undefined
  isStreaming,   // boolean
  isComplete,    // boolean
  error,         // Error | undefined
  sort,          // SortConfig | null
  filters,       // FilterConfig[]
  setSort,
  addFilter,
  removeFilter,
  clearFilters,
  getVisibleRows,
  exportCSV,
} = useTabularStream(config);
Everything you need to build an interactive table. Schema, accumulated rows, streaming state, sort and filter configuration, and functions to interact with the data.
Under the hood, the hook consumes an async generator:
const stream = createMockTabularStream(config);

for await (const event of stream) {
  if (!isMountedRef.current || cancelledRef.current) {
    break;  // Cleanup on unmount
  }

  switch (event.type) {
    case 'schema':
      setSchema(event.data);
      break;
    case 'table_row':
      setRows((prev) => [...prev, event.data]);
      break;
    case 'table_meta':
      setMetadata(event.data);
      setIsComplete(true);
      break;
  }
}
For-await-of loops through events. Switch on type. Schema sets the structure. Rows push to state. Metadata marks completion. The cleanup function cancels the stream if the component unmounts.
This pattern—async generators consumed by React hooks—is how all the streaming patterns work. It's not specific to tables. The same approach powers streaming text, streaming lists, and streaming charts.
Skeleton Loaders for Anticipated Data
While data streams in, the table shows skeleton rows for anticipated content:
function SkeletonRow({ columnCount }: { columnCount: number }) {
  return (
    <tr className={styles.skeletonRow}>
      {Array.from({ length: columnCount }).map((_, index) => (
        <td key={index} className={styles.skeletonCell}>
          <div className={styles.skeleton} />
        </td>
      ))}
    </tr>
  );
}

// Calculate skeleton rows
const skeletonRowCount = (() => {
  if (isComplete) return 0;
  if (!schema?.totalRows) return 0;
  return Math.max(0, schema.totalRows - rows.length);
})();

// In render:
{Array.from({ length: skeletonRowCount }).map((_, index) => (
  <SkeletonRow
    key={`skeleton-${index}`}
    columnCount={schema.columns.length}
  />
))}
The logic is simple: expected total minus received rows, floored at zero. When streaming completes, skeletons disappear. When all rows arrive, the footer renders with aggregated statistics.
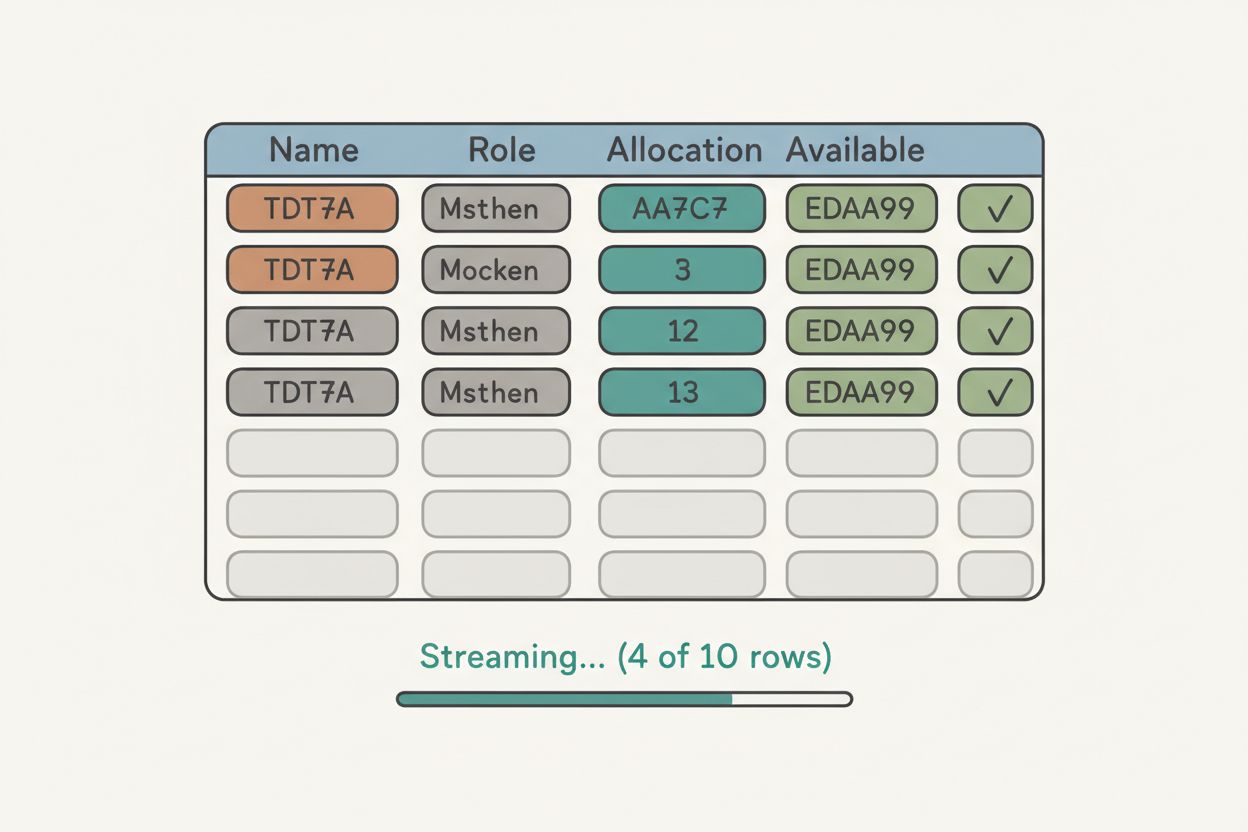
This creates continuity. Users know more data is coming. They're not surprised when new rows appear. The skeleton count communicates progress.
Sorting Partial Data
Here's where it gets interesting. Users can sort partial data.
Click the allocation column, rows reorder by what's available. A "(partial)" indicator warns that the sort may change as more data arrives.
This breaks traditional thinking. Sorting incomplete data feels wrong at first. But the alternative—disabling interaction for 30 seconds—is worse. Users understand "partial results" when you communicate it clearly.
Three strategies for sorting partial data:
Disable sorting while streaming — Safe but frustrating
Sort what's available, resort when complete — Our approach
Buffer until you have enough data — Delays first paint
We chose option two because immediate feedback trumps perfect accuracy. Users can see trends in the data even before it's complete. And when the final rows arrive, the table resorts. Clear communication makes this acceptable.
The sort implementation operates on whatever rows exist:
const getVisibleRows = useCallback((): TableRow[] => {
  let visibleRows = [...rows];

  // Apply filters (AND logic)
  if (filters.length > 0) {
    visibleRows = visibleRows.filter((row) => {
      return filters.every((filter) => applyFilter(row, filter));
    });
  }

  // Apply sorting
  if (sort && sort.direction) {
    visibleRows.sort((a, b) => {
      const aValue = a.values[sort.columnId];
      const bValue = b.values[sort.columnId];
      return compareValues(aValue, bValue, sort.direction === 'asc');
    });
  }

  return visibleRows;
}, [rows, filters, sort]);
Filters use AND logic—rows must match all active filters. Sort uses a comparison function that handles strings, numbers, and dates. Both operate on the current snapshot, not the final dataset.
Filtering works the same way. Select a column, choose an operator, enter a value. The filter applies immediately to available rows. As more rows stream in, they're filtered on arrival. No waiting.
CSV Export Before Completion
Export works before the stream completes. The button shows how many rows you'll get. Click it with five rows, you get a five-row CSV. Click it after completion, you get everything.
function rowsToCSV(schema: TableSchema | undefined, rows: TableRow[]): string {
  if (!schema || rows.length === 0) return '';

  const headers = schema.columns.map((col) => col.label).join(',');

  const dataRows = rows.map((row) => {
    return schema.columns
      .map((col) => {
        const value = row.values[col.id];
        if (value === null || value === undefined) return '';
        const stringValue = String(value);
        // Escape commas and quotes
        if (stringValue.includes(',') || stringValue.includes('"')) {
          return `"${stringValue.replace(/"/g, '""')}"`;
        }
        return stringValue;
      })
      .join(',');
  });

  return [headers, ...dataRows].join('\n');
}
The export function maps schema columns to headers, then rows to values with proper CSV escaping. It operates on getVisibleRows, meaning filters and sort are respected. Export what you see, not everything.
This is progressive enhancement. The feature works at every stage of streaming. Partial data is still useful data.
Production Gotchas
Layout shift. If column widths adjust to content, the table jumps around as longer values arrive. This is disorienting.
The fix is CSS table-layout: fixed with explicit column widths in the schema:
.table {
  width: 100%;
  border-collapse: collapse;
  table-layout: fixed;  /* Prevent layout shift */
}

.cell {
  padding: var(--space-3) var(--space-4);
  overflow: hidden;
  text-overflow: ellipsis;
  white-space: nowrap;
}
Columns stay stable. Long text truncates with ellipsis. No reflows.
Memory leaks. If the component unmounts mid-stream, you've got a generator still yielding events and state updates trying to fire on an unmounted component.
Always set a cancelled flag in your cleanup function. Check it before every state update. The streaming patterns implementation uses both a cancelled ref and a mounted ref for safety.
Debugging. When rows don't appear or arrive out of order, you need visibility into the event stream. The streaming patterns library includes a network inspector that captures every event with timestamps. Invaluable for understanding what's actually happening.
When to Use Streaming Tables
Use Tabular Stream View when:
Report generation — Rows compute independently
Search results — Relevance ranking streams naturally
Log viewers — Entries arrive continuously
Data imports — Show progress row by row
Don't use it when:
Small datasets — Overhead isn't worth it (under 20 rows)
Interdependent rows — Can't render row 5 until row 4 exists
Pivot tables — Require the full dataset to structure correctly
Groupings — Need all data to determine group boundaries
The pattern shines when rows are independently useful and users benefit from seeing partial results.
What You Get
Five key benefits:
Schema arrives first — Headers and skeletons render immediately
Time to first data beats total time — 300ms feels better than 30s
Users interact while streaming — Sort, filter, export all work on partial data
Skeleton loaders show progress — Users know more is coming
Fixed column widths prevent layout shift — No jarring reflows
The UX difference is dramatic. Users go from staring at spinners to engaging with data in under a second. The total time might be the same, but the perceived latency is orders of magnitude better.
Try It Yourself
The full implementation is live at streamingpatterns.com/patterns/tabular-stream-view. The demo shows schema arrival, progressive rows, sorting partial data, and mid-stream export.
The source code is on GitHub at vibeacademy/streaming-patterns. Clone it, run it locally, dig into the implementation.
If this shift from binary loading to progressive rendering clicked for you, the streaming patterns site covers six more patterns—streaming text, streaming lists, streaming charts, and others. Each one tackles a different UX problem that traditional request-response architectures can't solve cleanly.
If you want to go deeper on reading complex codebases and understanding patterns like this, I put together a free study guide covering the fundamentals. Get the AI Study Guide.