
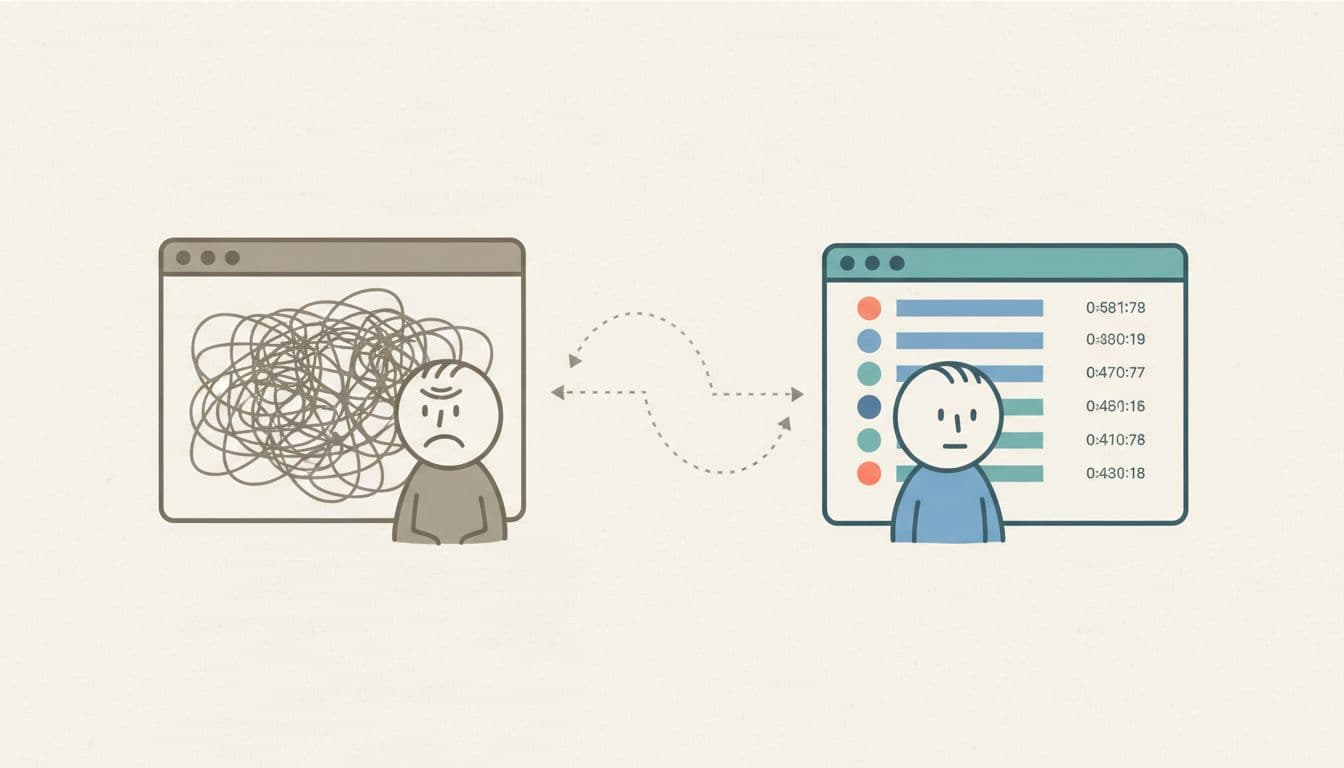
Browser DevTools are garbage for debugging streaming UIs. I mean that technically, not emotionally.
DevTools were designed for request-response HTTP. You make a request, you get a response, you inspect it. Clean. Simple. The Network tab shows you a list of discrete round-trips. But streaming AI interfaces don't work that way. You open a connection, and then events rain down continuously for seconds or minutes. The DevTools model breaks.
Try debugging a streaming UI in Chrome DevTools. You'll see your fetch request. You'll see the response headers. And then... nothing useful. The actual events—the reasoning steps, the partial answers, the memory updates—are all buried in an "EventStream" blob that you have to manually parse. By the time you've copy-pasted the raw text and formatted it, the bug you were chasing has scrolled off your mental stack.
This is why we built the Network Inspector.
What the Network Inspector Does
The Network Inspector is a React component that captures every streaming event in real-time and gives you visibility into what's actually happening. Think of it as the Chrome DevTools Network tab, but purpose-built for event streams.
It does four things:
1. Captures all events. Every event that flows through your stream gets captured with metadata: sequence number, timestamp, event type, and the full payload. Nothing is lost.
2. Displays events in real-time. As events arrive, they appear in the inspector immediately—within 50 milliseconds of emission. You can watch the stream unfold live.
3. Filters and searches. You can filter by event type (show only reasoning events, hide answer events) and search across all event data. When you're chasing a specific bug, you don't want to scroll through 200 events.
4. Exports to JSON. Capture a problematic stream, export it, and attach it to a bug report. Now your backend team can reproduce exactly what the frontend saw.
When to Use It
The Network Inspector solves three debugging scenarios that are painful without it:
Scenario 1: "The reasoning steps are out of order." A user reports that reasoning step 3 appears before reasoning step 2. Is this a frontend rendering bug or a backend ordering bug? With the inspector, you look at the sequence numbers. If events arrived out of order from the backend, the sequence numbers won't match the display order. Mystery solved in seconds.
Scenario 2: "The stream feels slow." Users complain that the AI seems to "pause" during responses. But where? The inspector shows timestamps for every event. You can calculate inter-event delays instantly. If there's a 2-second gap between event 4 and event 5, you now know exactly where to look in your backend.
Scenario 3: "Something weird is in the response." The AI generated something unexpected. Was it a malformed event? A bad confidence score? Instead of adding console.log statements everywhere and trying to reproduce the issue, just inspect the captured events. The full payload is right there, syntax-highlighted and expandable.
How to Integrate It
The inspector integrates with any streaming implementation that emits events. The pattern is simple:
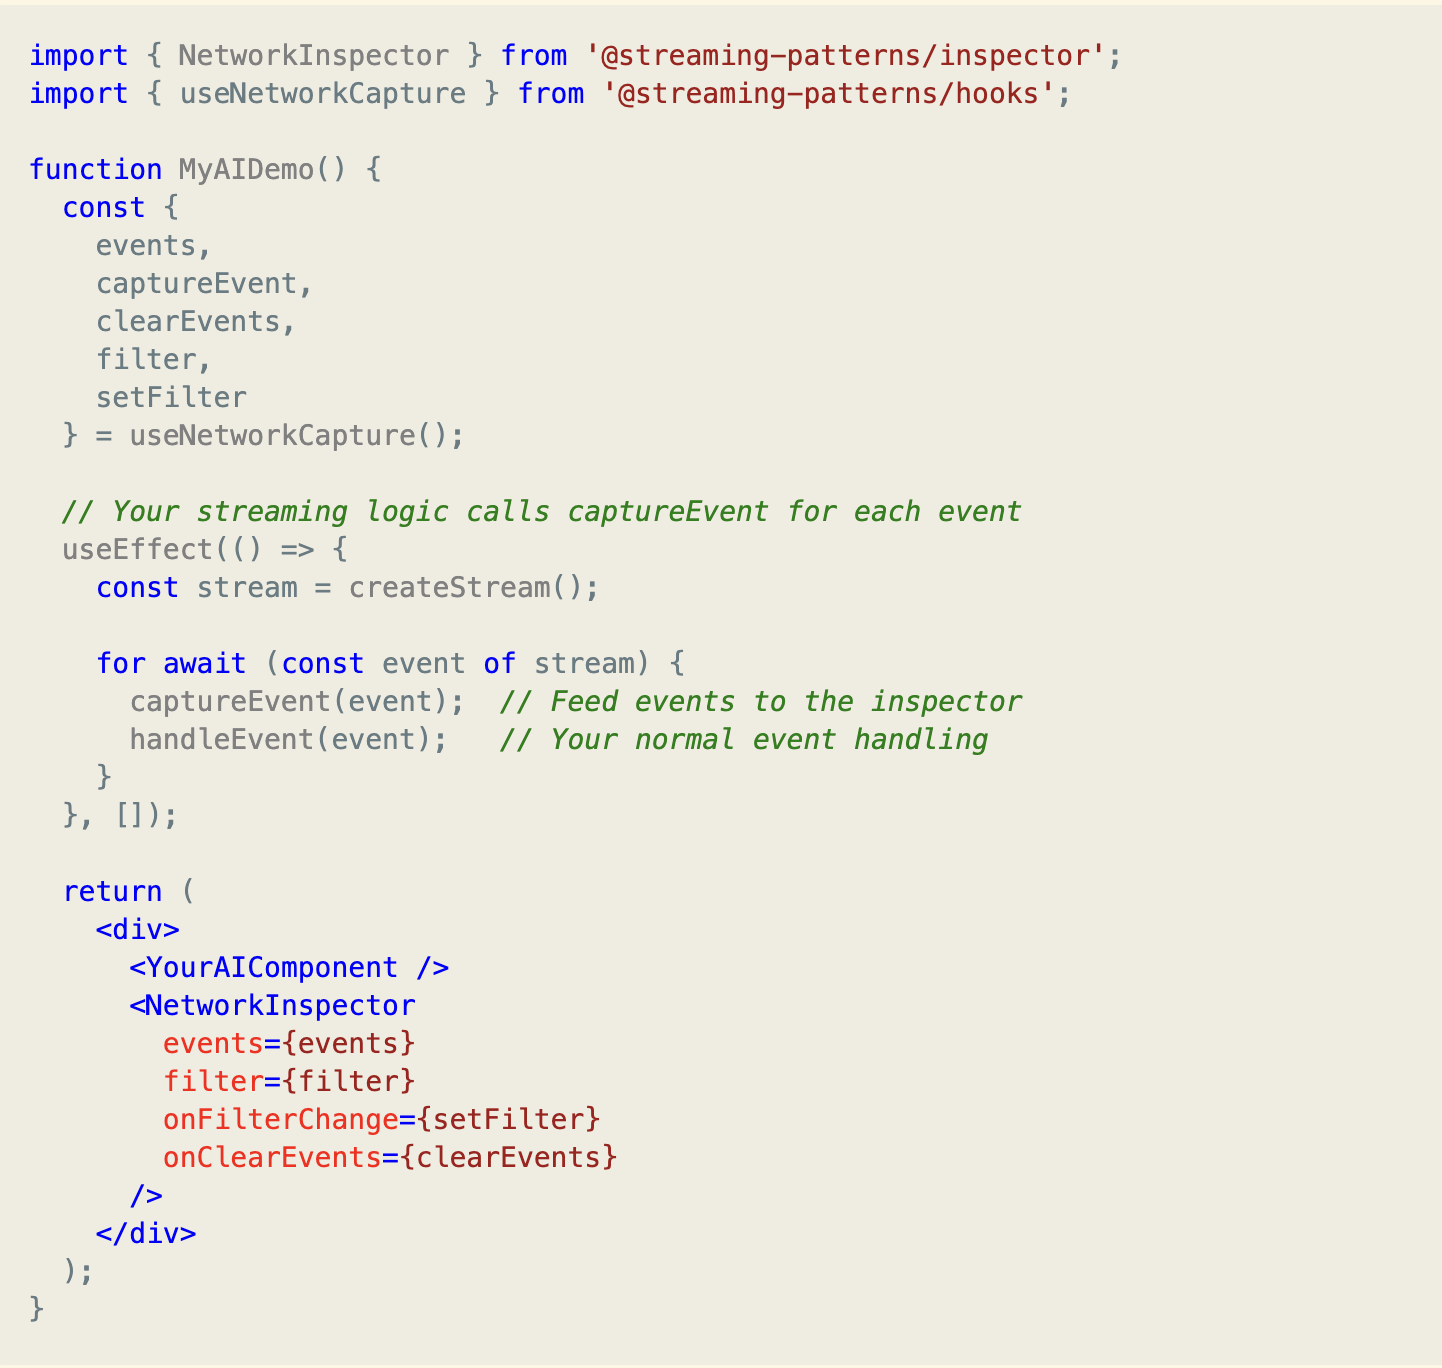
The useNetworkCapture hook manages state. The NetworkInspector component renders it. That's the whole integration.
The key is the captureEvent function. Call it for every event that comes through your stream, and the inspector will handle the rest—timestamping, sequencing, filtering, and display.
The Interface
The inspector has three main areas:
Header. Shows total event count, with buttons to export and clear. The export generates a JSON file containing all captured events with full metadata.
Toolbar. A search input and filter chips. Type in the search box to filter events by content. Click type chips to show/hide specific event types. If your stream has reasoning, answer, and memory events, you can toggle each type independently.
Event List. The main display. Each event shows:
Sequence number #1, #2, #3...)
Event type badge with color coding
Timestamp in HH:MM:SS.mmm format
Elapsed time since stream start +0ms, +142ms, +1.23s)
Compact preview of the event payload
Click any event to expand it. The detail panel shows the full JSON payload, syntax-highlighted and formatted. This is where you inspect the actual data—confidence scores, reasoning text, memory snapshots, whatever your events contain.
Performance Considerations
The inspector captures events and updates the DOM in real-time. This could tank performance if done naively. Here's what we did:
Stable callback references. The captureEvent function from useNetworkCapture uses useCallback with an empty dependency array. This means your stream consumer doesn't re-render when events accumulate.
Memoized filtering. Event filtering uses useMemo. When you type in the search box, only the filter computation re-runs—not the entire event capture logic.
Minimal DOM updates. The event list only renders visible events. If you have 500 captured events but only 20 are visible after filtering, only 20 DOM elements exist.
The result: less than 5% overhead on stream performance, even with the inspector running. We tested this with 1000-event streams. The inspector is designed to observe, not interfere.
What This Replaces
Before the Network Inspector, debugging streaming UIs meant:
1. Adding console.log statements inside event handlers
2. Scrolling through the browser console trying to find the relevant output
3. Manually reconstructing the sequence of events
4. Realizing you forgot to log something important
5. Restarting the stream and trying again
6. Copy-pasting raw event data into a JSON formatter
7. Losing your place when a colleague asks you a question
The inspector replaces all of this with a persistent, filterable, exportable view of exactly what happened. It's the difference between debugging blind and debugging with instrumentation.
Try It
The Network Inspector is part of the Streaming Patterns library. You can see it in action on any of the pattern demos—Chain-of-Reasoning, Streaming Memory, Interactive Schema, all of them include the inspector.
Play with a demo. Watch the events stream in. Filter by type. Search for a keyword. Export the log. Get a feel for how visibility changes your debugging workflow.
Once you have this level of observability, you won't want to debug streaming UIs any other way.
---
If you want to go deeper on AI/UX patterns and how to debug them effectively, I put together a free study guide. Grab the AI Study Guide here.